
Credit is counted twice
Each platform counts the same order as its own, especially retargeting and brand search.
Marketing Mix Modeling · Philippines
Marketing mix modeling built for Philippine ecommerce: your website and every marketplace in one view, with promos, holidays and every other driver of your sales accounted for, explained in plain language.
Synthetic demo brand. Figures are illustrative.
The problem
Meta, Google, TikTok and the marketplaces each report their own conversions. Added together they claim more revenue than you made, and none of them can tell you what would have happened without the ad.
Each platform counts the same order as its own, especially retargeting and brand search.
An ad on one platform can sell on another: a TikTok ad can sell on Shopee or on your website.
9.9, 11.11, paydays and holidays lift demand on their own, and get mistaken for ad results.
The product
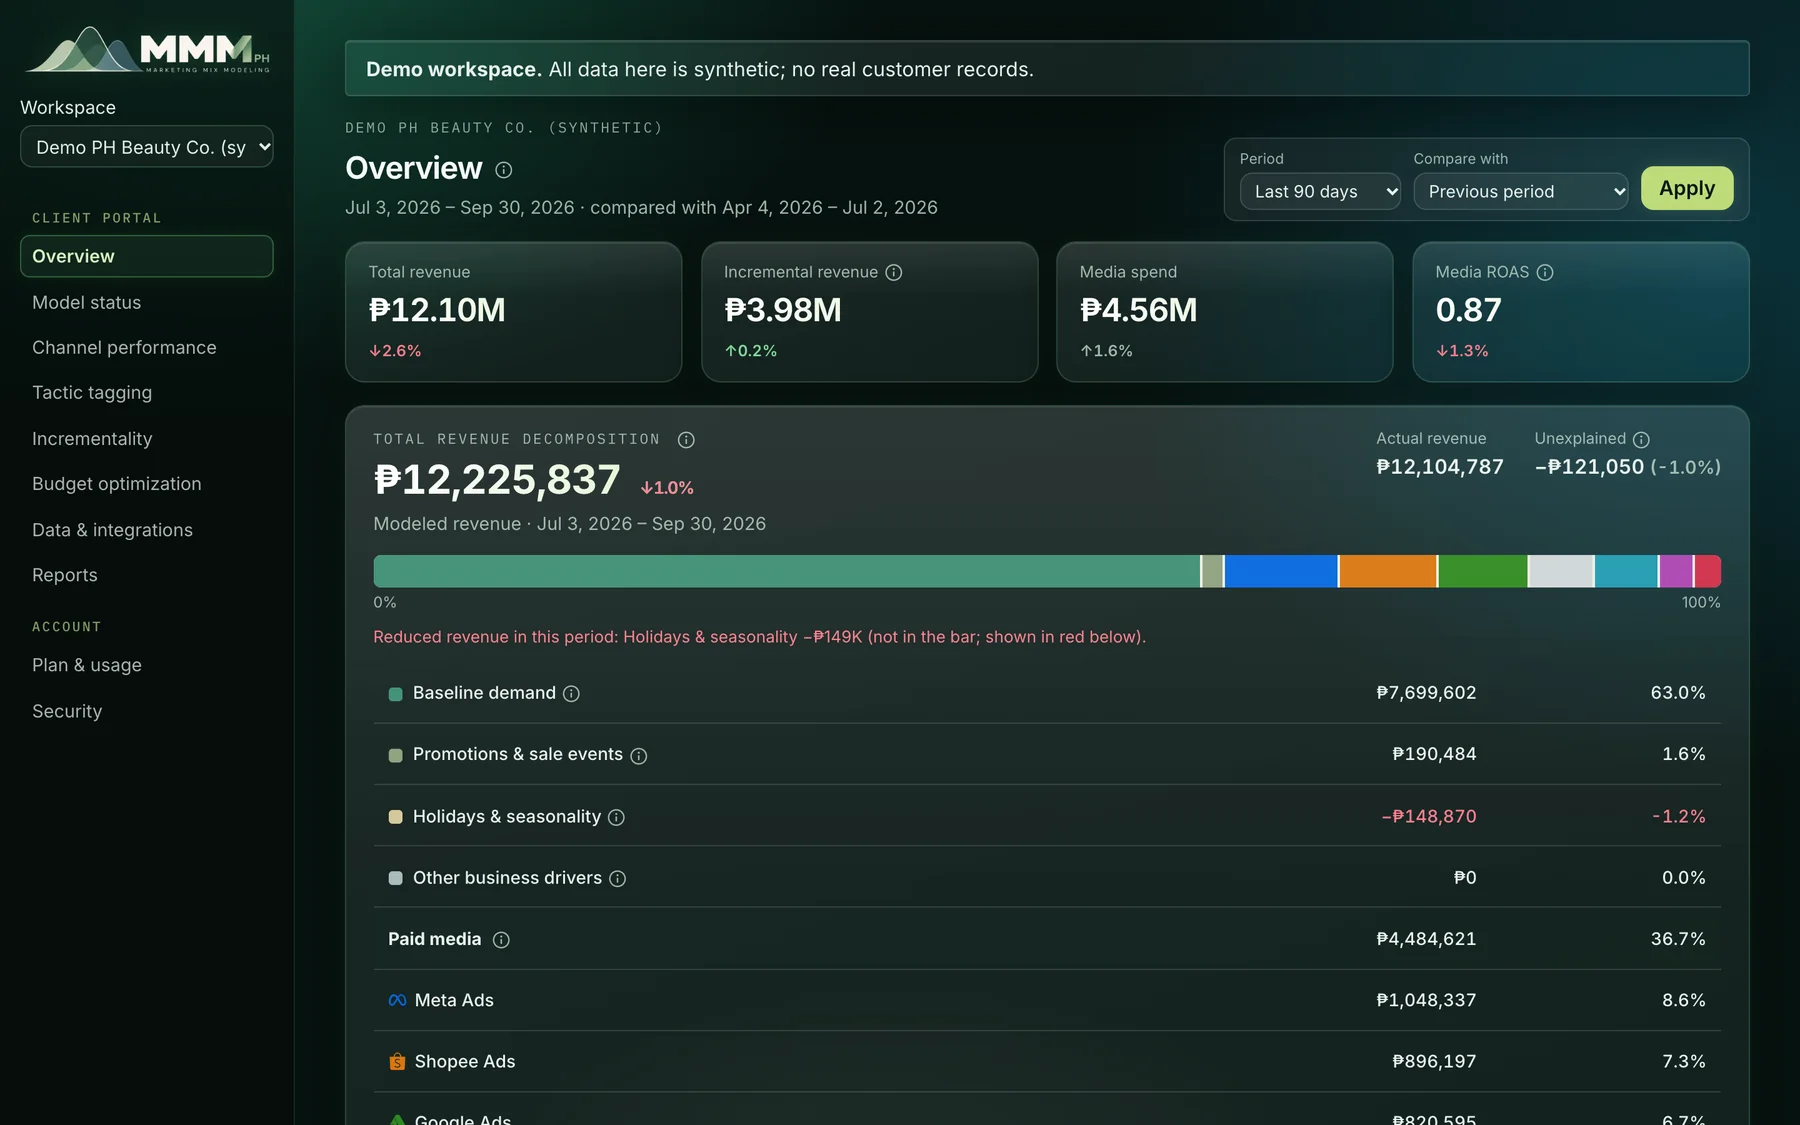
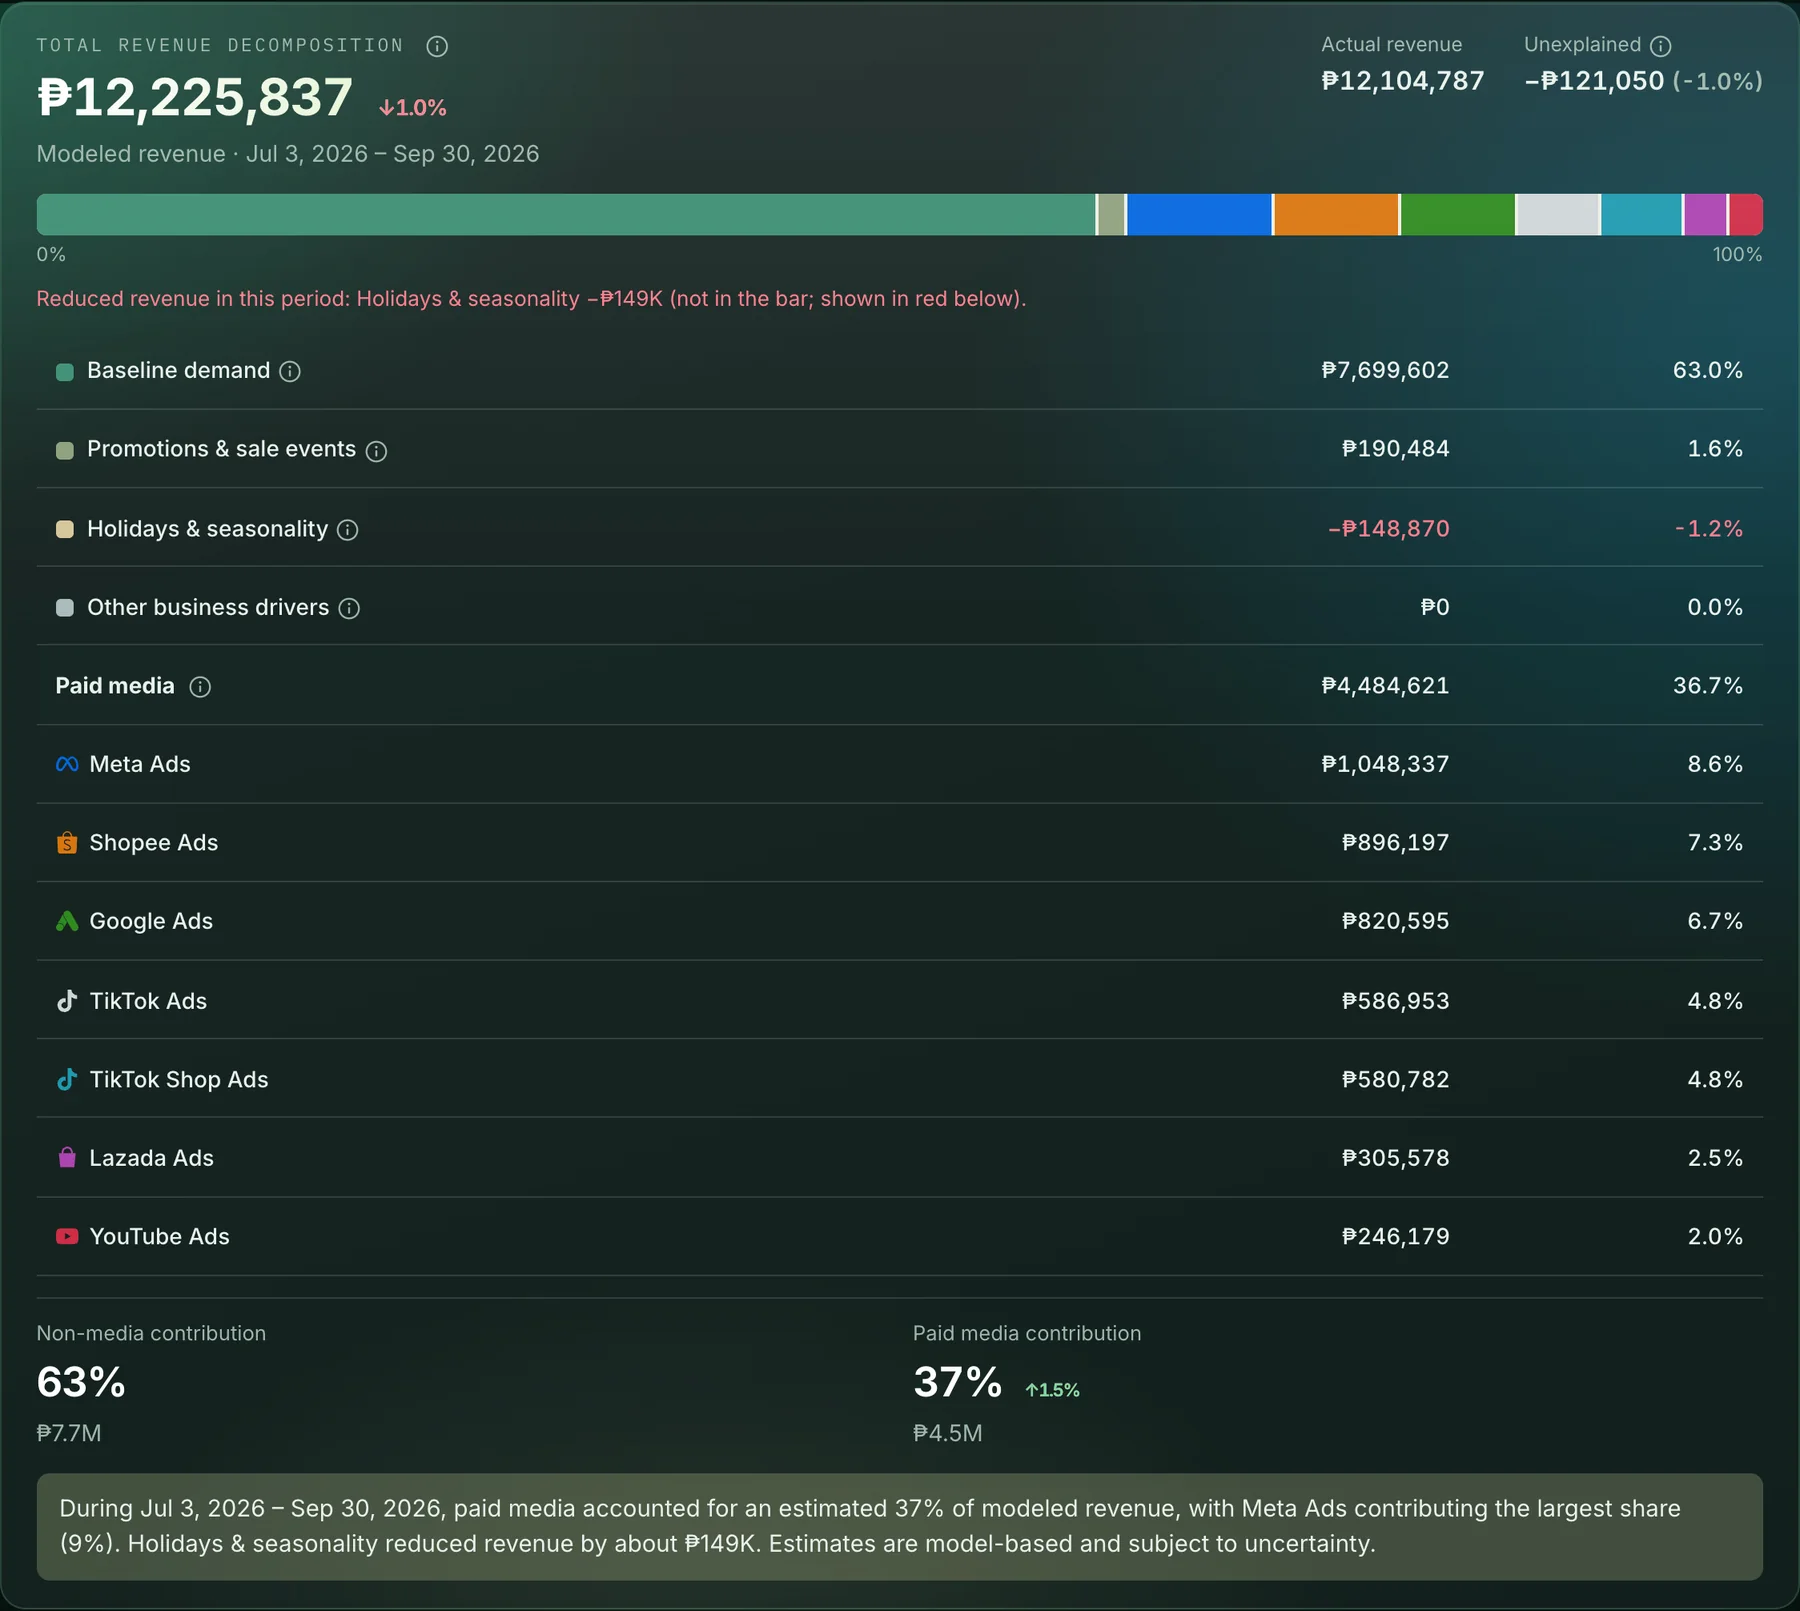
Modeled revenue split into baseline demand, promotions and sale events, holidays and seasonality, and each paid channel, in pesos and percent.
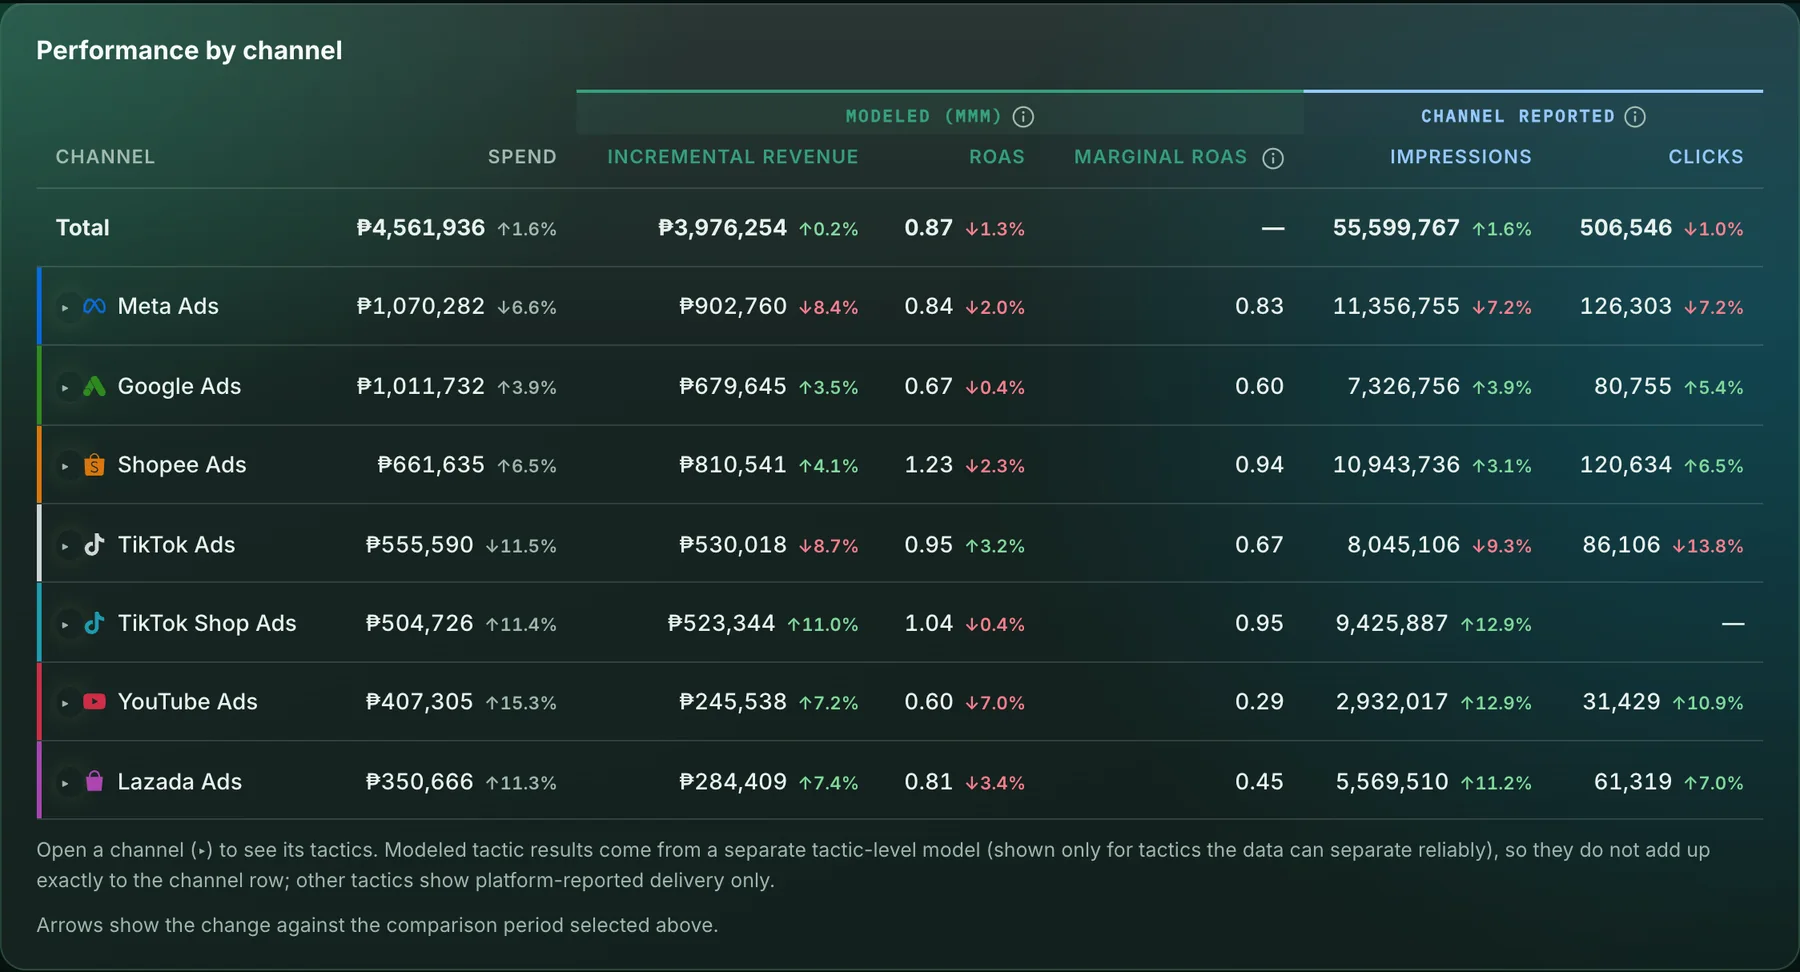
Spend, incremental revenue, ROAS and the return on the next peso for every channel, beside impressions and clicks as each platform reports them.
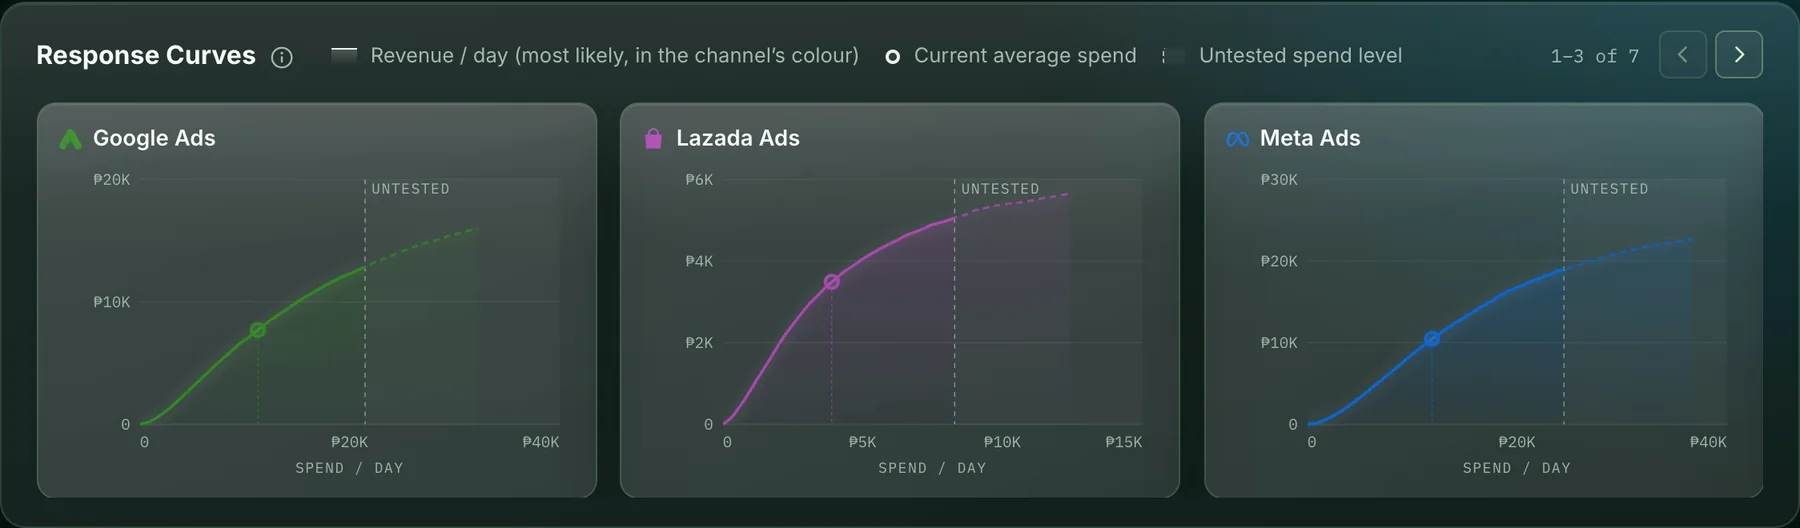
Response curves show how revenue grows with spend for each channel, where you are today, and where spend has never been tested.
Enter next month's budget. We forecast revenue if you keep your current split and with the split the model recommends, channel by channel, for the same budget and dates.

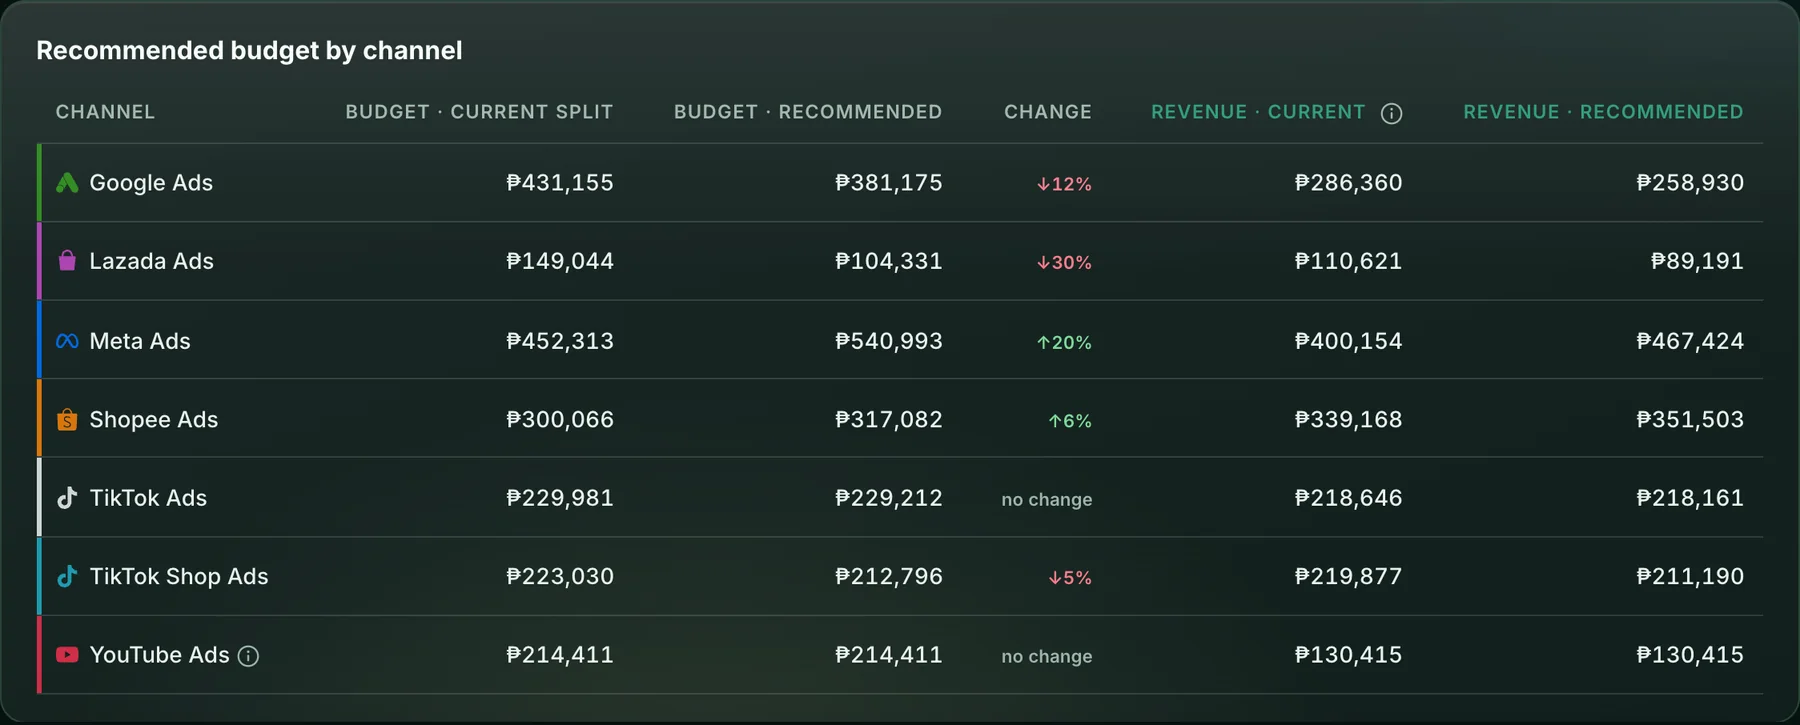
Screens show a synthetic demo brand. Figures are illustrative.
How it works
18–24 months of daily data: ad exports, store and marketplace orders, promotions. CSV or our sheet template.
We map channels, campaigns and stores, run data quality checks and resolve issues with you.
Trained, checked and reviewed by an analyst, then released to your dashboard.
Refreshed on your plan's schedule; experiments sharpen results over time.
Methodology
Daily revenue is modeled as a base level, the yearly season, the sales calendar and promotions, and each paid channel's response to its spend. Carry-over and diminishing returns are built in.
Every estimate is a probability distribution, so every number comes with an honest range.
Channels your data cannot separate are flagged and kept out of results and plans.
Lift-test results calibrate the model. Until experiments confirm them, results are labelled directional.
Pricing
Every plan includes the full Bayesian model of your total revenue, analyst review before release, and the budget planner. Plans differ in how many channels and stores we model, how often we refresh, and how much support you get.
Monthly ad spend up to ₱500K
₱9,900 /mo
₱2,500 one-time onboarding
Monthly ad spend ₱500K–₱2M
₱24,900 /mo
₱5,000 one-time onboarding
Monthly ad spend ₱2M–₱10M
₱49,900 /mo
₱12,500 one-time onboarding
Monthly ad spend ₱10M+
from ₱100,000 /mo
from ₱30,000 one-time onboarding
Prices in PHP per month, before VAT.
We set up your model, review the results with you, and plan your next budget together.
FAQ
Platform ROAS counts the conversions each platform can see and credits itself. MMM PH models your total revenue across every store at once, so the same order is never counted twice and sales that happen on a different platform from the ad are included.
18–24 months of daily data: campaign exports with spend, impressions and clicks from Meta, Google, TikTok, Shopee, Lazada and TikTok Shop ads; order exports from your website and each marketplace; and your sale calendar. Stock-outs, site outages and delivery disruptions help if you have them.
No. Customer names and addresses are never stored, and order IDs are anonymised on upload.
Not on its own. A marketing mix model estimates effects from historical data, with ranges. Lift tests are the strongest evidence; their results calibrate the model, and results are labelled directional until experiments confirm them.
If your data cannot separate a channel's effect, we flag it and keep it out of results and budget recommendations rather than guess.
Book a demo
We'll walk you through the platform on a synthetic brand, look at what data you have, and tell you honestly whether a model will work for you.